knn
"/home/yossef/notes/personal/ml/knn.md"
path: personal/ml/knn.md
- **fileName**: knn
- **Created on**: 2025-04-28 12:35:16
KNN -> k-nearest Neighbor
KNN: is simple way to classify nodes by looking at things that near by
that node
KNN is also called with lazy learner algorithm because it does not learn
the training set immediately instead it stores in Dataset and with time learing
from this data
Steps how works
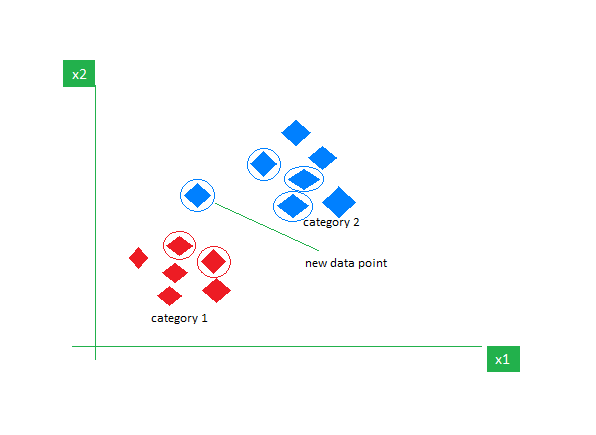
- The red diamonds represent Category 1 and the blue squares represent Category 2.
- The new data point checks its closest neighbours (circled points).
- Since the majority of its closest neighbours are blue squares
(Category 2) KNN predicts the new data point belongs to Category 2
what is the knn nearest neighbours?
k is the number that tell the algorithm number of neighbours nodes that gone
look at
so how many k should be in algorthim
lets say what you should using it's better :D
- k = 1 , because can't tell that the new node belong to which group
from first seeing node like someone come to married your daughter
so you go out to ask people about this person if he good or not
can't ask one person ot know someone maybe this person hate him or
his friend so gone be Bayes in his openion - k = number / 2 = (int) => even number because maybe the statistical operation
gone be 50% over 50% present. - so for this must using a odd number and not 1 and gone be any thing
optimal value of k depends on the characteristics of the input data.
If the dataset has significant outliers or noise a higher k can help smooth
out the predictions and reduce the influence of noisy data. However choosing
very high value can lead to underfitting where the model becomes too simplistic.
Cross-Validation: A robust method for selecting the best k is to perform k-fold
cross-validation. This involves splitting the data into k subsets training the model
on some subsets and testing it on the remaining ones and repeating this for each subset.
The value of k that results in the highest average validation accuracy is
usually the best choice.
Elbow Method: In the elbow method we plot the model’s error rate or accuracy
for different values of k. As we increase k the error usually decreases initially.
However after a certain point the error rate starts to decrease more slowly.
This point where the curve forms an “elbow” that point is considered as best k.
Odd Values for k: It’s also recommended to choose an odd value for k especially
in classification tasks to avoid ties when deciding the majority class.
Distance Metrics Used in KNN Algorithm
- Euclidean Distance
- Manhattan Distance
- Minkowski Distance
final steps
- Step 1: Selecting the optimal value of K
- Step 2: Calculating distance
- Step 3: Finding Nearest Neighbors
- Step 4: Voting for Classification or Taking Average for Regression
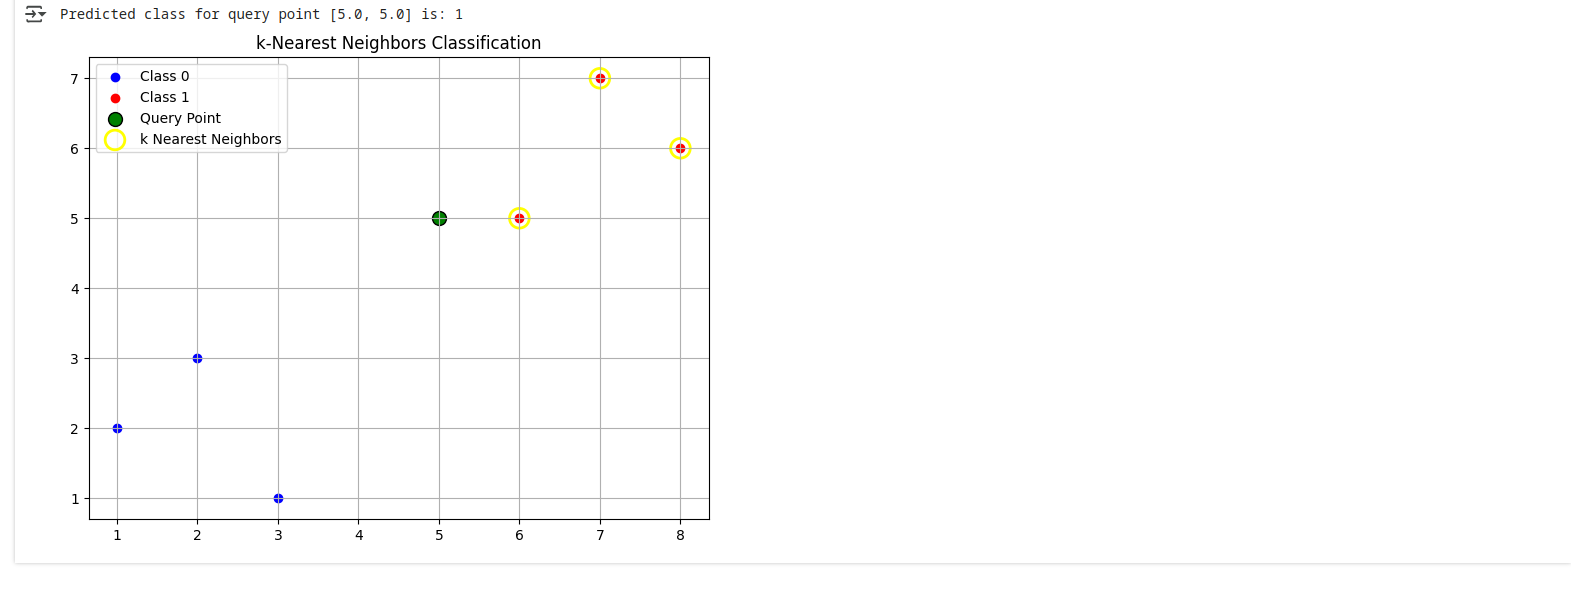
example code
import torch
import matplotlib.pyplot as plt

# Generate a simple dataset (2 classes, 2D points)
# Class 0 points
class0 = torch.tensor([[1.0, 2.0],
                       [2.0, 3.0],
                       [3.0, 1.0]])

# Class 1 points
class1 = torch.tensor([[6.0, 5.0],
                       [7.0, 7.0],
                       [8.0, 6.0]])

# Stack data and create labels
data = torch.cat([class0, class1], dim=0)
labels = torch.tensor([0, 0, 0, 1, 1, 1])  # 0 for class0, 1 for class1

# Define a new point to classify
query_point = torch.tensor([5.0, 5.0])

# Define number of neighbors
k = 3

# Calculate Euclidean distance between query point and all data points
distances = torch.norm(data - query_point, dim=1)

# Get indices of the k nearest points
knn_indices = distances.topk(k, largest=False).indices

# Get the labels of the k nearest points
knn_labels = labels[knn_indices]

# Majority vote: predict the class
predicted_label = knn_labels.mode().values.item()

print(f"Predicted class for query point {query_point.tolist()} is: {predicted_label}")

# Plotting
plt.figure(figsize=(8, 6))

# Plot class 0 points
plt.scatter(class0[:, 0], class0[:, 1], color='blue', label='Class 0')

# Plot class 1 points
plt.scatter(class1[:, 0], class1[:, 1], color='red', label='Class 1')

# Plot the query point
plt.scatter(query_point[0], query_point[1], color='green',
            label='Query Point', edgecolors='black', s=100)

# Highlight the k nearest neighbors
plt.scatter(data[knn_indices][:, 0], data[knn_indices][:, 1],
            facecolors='none', edgecolors='yellow', s=200,
            linewidths=2, label='k Nearest Neighbors')

plt.legend()
plt.title('k-Nearest Neighbors Classification')
plt.grid(True)
plt.show()
some references
-
continue:./linear_regression.md
before:./k-mean.md