k-mean
"/home/yossef/notes/personal/ml/k-mean.md"
path: personal/ml/k-mean.md
- **fileName**: k-mean
- **Created on**: 2025-04-27 20:28:49
K MEAN: let's starting with define the word CLUSTER
Cluster: is mean a split and a group of sets by adding to each group a center
so CLUSTER is: is one of most common tasks in ml by grouping similar data
together , it's most popular and common in using ml models and very simple
one too so what this mean and how this works first look at this img :D
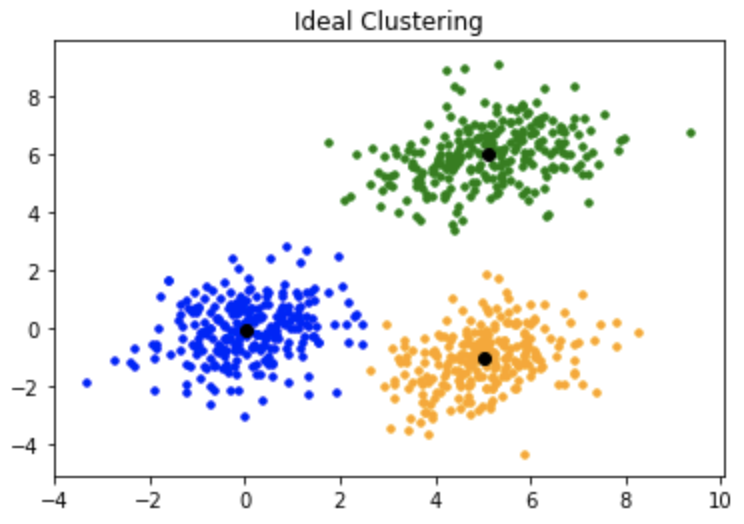
so now from image we making a random points first and then trying ot making a point
in center for each group this called (centroids) so the goal in key main
to find the centroids for each group in fast way possable
so now this operation of founding the centroid for each group is repeated until the centroid
don't change this mean that it's found the best place for centroid and if you specify a number
of rounds for the model training
so how ot use this centriod using a manhtane distance calclate the distacne for each node in group and the centriod for each group and then select the lowest distance and adding the node to selected group of this centroid this how ot calc a centriod and and distance between nodes
so this process is repeated until the centroid don't change his position this mean this the best
centroid for this group
for example:
# Import required libraries
import numpy as np  # For numerical computations and handling arrays
import pandas as pd  # (Unused here) - typically used for handling tabular data
import matplotlib.pyplot as plt  # For plotting the data and centroids
import sys  # For using system-specific parameters, here to use the largest integer value

# Define the mean and covariance for the first distribution (cluster)
mean_01 = np.array([0.0, 0.0])  # Center at (0,0)
cov_01 = np.array([[1, 0.3], [0.3, 1]])  # Slightly correlated features
dist_01 = np.random.multivariate_normal(mean_01, cov_01, 100)  # Generate 100 points

# Define the mean and covariance for the second distribution (cluster)
mean_02 = np.array([6.0, 7.0])  # Center at (6,7)
cov_02 = np.array([[1.5, 0.3], [0.3, 1]])  # Features slightly correlated
dist_02 = np.random.multivariate_normal(mean_02, cov_02, 100)  # Generate 100 points

# Define the mean and covariance for the third distribution (cluster)
mean_03 = np.array([7.0, -5.0])  # Center at (7,-5)
cov_03 = np.array([[1.2, 0.5], [0.5, 1]])  # Features moderately correlated
dist_03 = np.random.multivariate_normal(mean_03, cov_01, 100)  # Generate 100 points (uses wrong covariance - cov_01)

# Define the mean and covariance for the fourth distribution (cluster)
mean_04 = np.array([2.0, -7.0])  # Center at (2,-7)
cov_04 = np.array([[1.2, 0.5], [0.5, 1.3]])  # Different variances along axes
dist_04 = np.random.multivariate_normal(mean_04, cov_01, 100)  # Generate 100 points (uses wrong covariance - cov_01)

# Stack all distributions into one dataset
data = np.vstack((dist_01, dist_02, dist_03, dist_04))

# Shuffle the data randomly
np.random.shuffle(data)

# Function to plot the data points and centroids
def plot(data, centroids):
    # Plot all data points in gray color
    plt.scatter(data[:, 0], data[:, 1], marker='.', color='gray', label='data points')
    # Plot all previously selected centroids in black
    plt.scatter(centroids[:-1, 0], centroids[:-1, 1], color='black', label='previously selected centroids')
    # Plot the latest selected centroid in red
    plt.scatter(centroids[-1, 0], centroids[-1, 1], color='red', label='next centroid')
    # Set the title showing which centroid is being selected
    plt.title('Select % d th centroid' % (centroids.shape[0]))
    # Show legend
    plt.legend()
    # Set x-axis limits
    plt.xlim(-5, 12)
    # Set y-axis limits
    plt.ylim(-10, 15)
    # Display the plot
    plt.show()

# Function to calculate Euclidean distance between two points
def distance(p1, p2):
    return np.sqrt(np.sum((p1 - p2)**2))  # Squared differences summed and then square-rooted

# Function to initialize centroids using K-means++ method
def initialize(data, k):
    '''
    Initializes the centroids for K-means++
    Inputs:
        data - numpy array of data points with shape (400, 2)
        k - number of clusters
    '''
    centroids = []  # List to store the centroids

    # Randomly pick the first centroid from the data points
    centroids.append(data[np.random.randint(data.shape[0]), :])
    plot(data, np.array(centroids))  # Plot after choosing first centroid

    # Select remaining k-1 centroids
    for c_id in range(k - 1):

        dist = []  # List to store the minimum distance of each point to any selected centroid

        # For each data point
        for i in range(data.shape[0]):
            point = data[i, :]  # Current point
            d = sys.maxsize  # Initialize distance with maximum possible integer

            # Compare current point to all selected centroids
            for j in range(len(centroids)):
                temp_dist = distance(point, centroids[j])  # Compute distance
                d = min(d, temp_dist)  # Keep the minimum distance found

            dist.append(d)  # Store the minimum distance for this point

        dist = np.array(dist)  # Convert list to array

        # Select the point with the maximum distance as next centroid
        next_centroid = data[np.argmax(dist), :]
        centroids.append(next_centroid)  # Add new centroid to list
        dist = []  # Clear the distance list

        plot(data, np.array(centroids))  # Plot after choosing each centroid

    return centroids  # Return the list of selected centroids

# Initialize centroids for K-means++ with k=4 clusters
centroids = initialize(data, k=4)
Applications of k-means++ algorithm
- Image segmentation: It can be used to segment images into different regions based on their color or texture features. This is useful in computer vision applications, such as object recognition or tracking.
- Customer segmentation: These are used to group customers into different segments based on their purchasing habits, demographic data, or other characteristics. This is useful in marketing and advertising applications, as it can help businesses target their marketing efforts more effectively.
- Recommender systems: K-means++ can be used to recommend products or services to users based on their past purchases or preferences. This is useful in e-commerce and online advertising applications.
in k-means can use any function for calc the destance between nodes and centroid
like Euclidean distance Manhattan distance or make a custom one
- Euclidean distance = "as the crow flies" distance.
Imagine drawing a straight line between two points.
Formula: - Manhattan distance = distance if you can only move horizontally or vertically (like walking city blocks).
Formula:
K-Means with plotting after each iteration
import torch
import matplotlib.pyplot as plt

# Set random seed for reproducibility
torch.manual_seed(0)

# Generate 100 random 2D points (data points)
points = torch.randn(100, 2)

# Set the number of clusters
k = 3

# Randomly pick k points as the initial centers
indices = torch.randperm(points.size(0))[:k]
centers = points[indices]

# Number of iterations to run K-Means
n_iters = 10

# Run K-Means algorithm
for iter in range(n_iters):
    # Compute distance from each point to each center
    dists = torch.cdist(points, centers)

    # Assign each point to the nearest center
    labels = dists.argmin(dim=1)

    # Create a new plot for this iteration
    plt.figure(figsize=(6, 6))
    for i in range(k):
        # Select points assigned to cluster i
        cluster_points = points[labels == i]
        # Plot the points of cluster i
        plt.scatter(cluster_points[:, 0], cluster_points[:, 1], label=f"Cluster {i}")

    # Plot the centers
    plt.scatter(centers[:, 0], centers[:, 1],
                c='black', marker='x', s=100, label='Centers')

    # Add title and legend
    plt.title(f"Iteration {iter}")
    plt.legend()

    # Show the plot
    plt.show()

    # Update centers: move each center to the mean of its assigned points
    for i in range(k):
        mask = labels == i  # mask to select points assigned to cluster i
        if mask.any():  # make sure the cluster has points
            centers[i] = points[mask].mean(dim=0)
some references
-
continue:./knn.md
before:[[]]